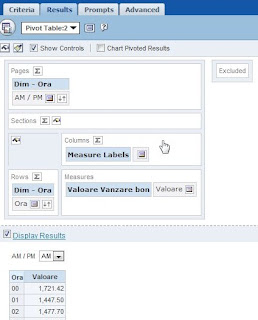
First of all you have to create the views (tables, charts, pivottable...) that you want to view them using view selectors. I will create two charts and two pivottables and put the charts in a view selector, the two pivots in another view selector and at the end those two viewselectors in one view selector..
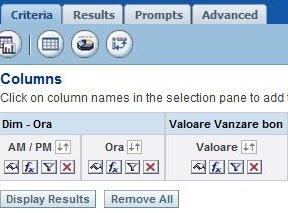
1. First step add columns that you want in report.
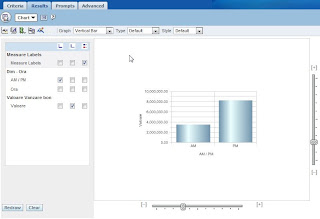
 2. Create one chart and add it in compund layout...
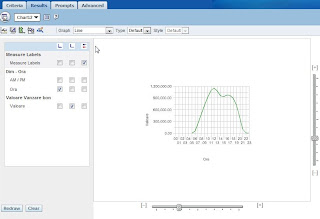
 3. Add another chart into compound layout (this will create chart2)
 4. Add pivot table in compound layout (it will create pivottable 1)
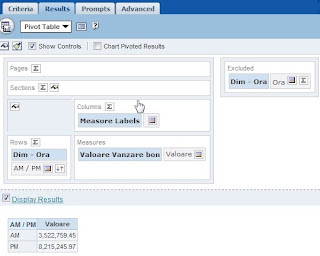 5. Add another pivot table in compound layout (it will create pivottable 2)
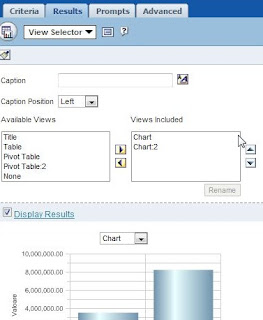
 6. Add view selector into compound layout (it will create view selector 1). Add those two charts in it. Modify the caption to indicate each chart what represents.
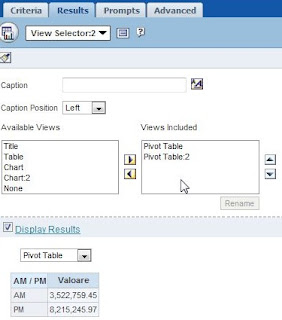
 7. Add another view selector into compound layout (it will create view selector 2). Add those two pivots in it. Modify the caption to indicate each pivot what represents.
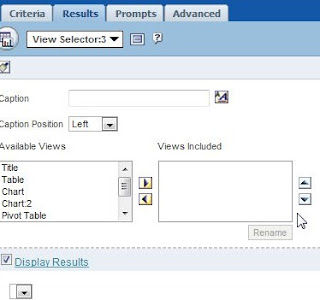
 8. Add another view selector into compound layout (it will create view selector 3). Don't add anything in it...
 9. Go to compound layout and remove the charts and pivot tables, let just the view selectors.
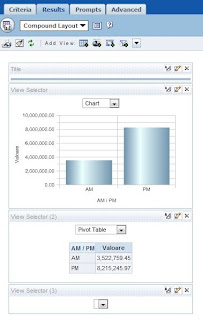 10. Go to Advanced tab and search for the "saw: view .... viewselector3..." you will see that tag viewList is empty...
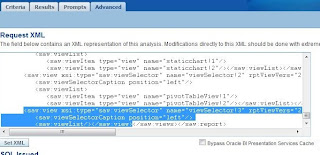 11. Modify the tag by adding tw0 lines with our 2 view selectors as shown below... And press SetXML button.
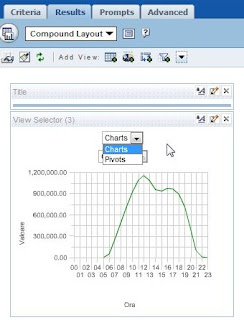
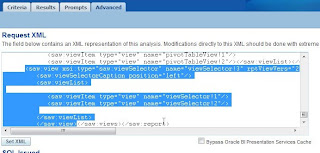 12. Go to Results tab and see that view selector 3 contains 2 view selectors. Edit view selector to set captions for view selectors to tell users what it represents...
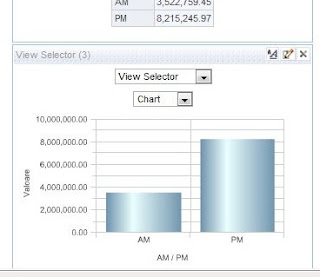 And at the end remove from compound layout first 2 viewselectors...
See you next time...
Regards
Nicolae Ancuta